Power BI templates
The template is a ready-made Power BI report for Zendesk Support: pages, charts and calculations, all set up. You open it, paste a feed URL, and your data fills the report. The file itself holds no data and no passwords.
Get the template
Section titled “Get the template”Download the Zendesk Support template (.pbit, about 20 KB).
It uses only the standard Zendesk fields, so it works with any Zendesk account. To add your own fields, see Adding your custom fields.
Open it
Section titled “Open it”Power BI Desktop runs on Windows only.
- Double-click the
.pbitfile. When Power BI asks for FeedUrl, paste a feed URL from the Datasources tab of the app and select Load. - Sign in with Basic: user name
export, password = an API token. See Load data into Power BI. - Save the report as a
.pbixfile to keep the data and your edits.
To refresh it on a schedule, publish it and enter the token in the Power BI Service. See Scheduled refresh.
What the datasource needs
Section titled “What the datasource needs”The template reads these tables: Tickets, Ticket metrics, Users, Groups and Ticket tags. Select them when you create the datasource. If a datasource doesn’t include one of them, the template still loads. That table just comes in empty, and the visuals that use it stay blank.
Report pages
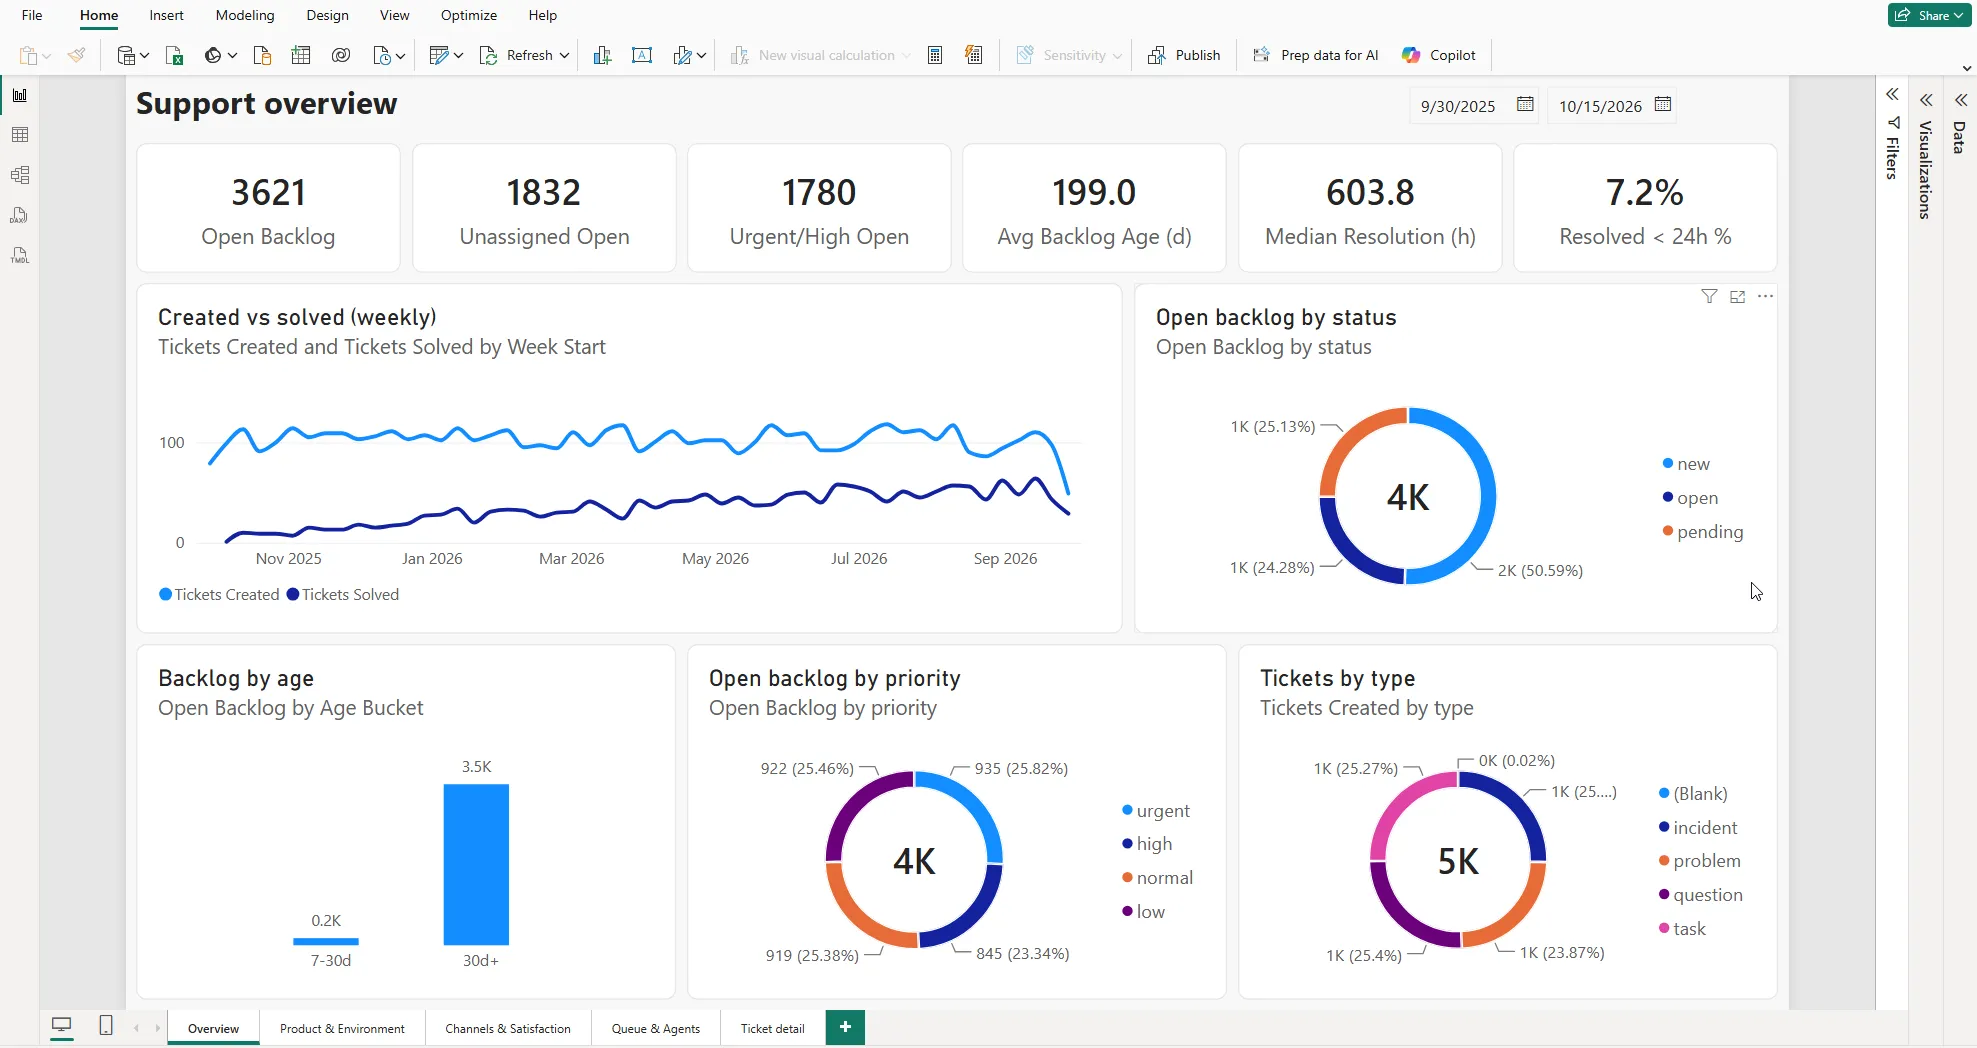
Section titled “Report pages”- Overview: open backlog, unassigned and urgent tickets, backlog age, median resolution time, weekly created vs solved, backlog by age, and the open backlog split by status and by priority, plus tickets by type.
- Channels & Satisfaction: CSAT, rated tickets, survey response rate, first reply time and average replies per ticket, tickets by channel and group, and CSAT by month and by group.
- Queue & Agents: a per-agent table (backlog, solved, resolution time, replies per ticket, reopen rate) with tags, and the open backlog by group.
- Ticket detail: a filterable list of tickets, each linking back to Zendesk.
Things to know
Section titled “Things to know”- Your custom fields aren’t loaded automatically. The template loads the standard Zendesk fields only, so it opens on any account. Your own fields take a minute to add, see Adding your custom fields.
- Backlog figures ignore the date range. Open Backlog, Unassigned Open and the other backlog measures show what is open right now, whatever dates you pick.
- Resolution figures follow the solved date. Median and P90 resolution, Resolved < 24h, Reopen Rate and Avg Replies per Ticket count the tickets solved in the date range you pick.
- Resolution times are in calendar time. Business-hours variants stay empty unless your Zendesk account has a business schedule.
- CSAT % is good ratings divided by good plus bad ratings. Survey Response % is rated tickets divided by offered plus rated.
Adding your custom fields
Section titled “Adding your custom fields”The feed sends every custom ticket field as a column (see Custom fields), but the template loads only the standard fields, so that it opens on any Zendesk account. To bring in your own fields:
-
In Power BI Desktop, select Transform data.
-
Select the Tickets query, then Home → Advanced Editor.
-
Find the list that starts with
Keep = Table.SelectColumns(Raw, {and add your field names to it, in quotes. They are the field titles from Zendesk, with punctuation removed (see Column names). For example:"satisfaction_score", "url", "created_at", "updated_at", "due_at","Product", "Order Return Date" -
Select Done, then Close & Apply.
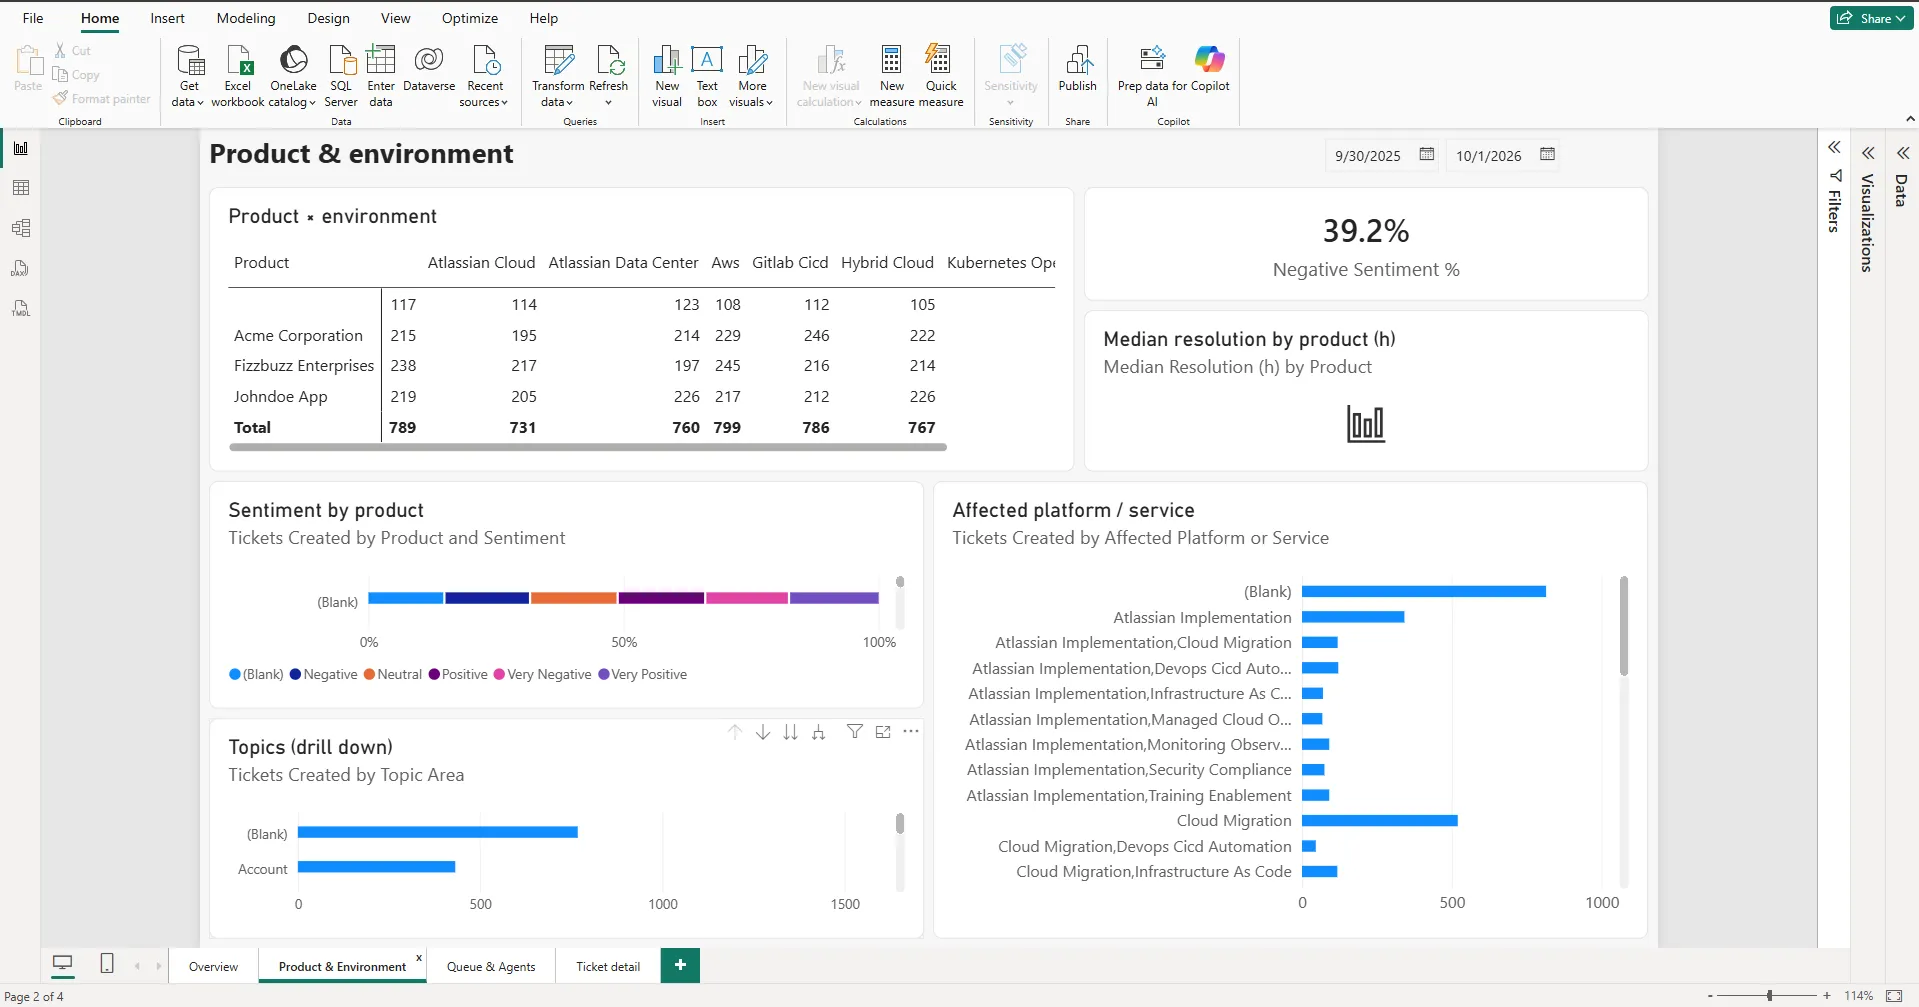
The fields now appear on the Tickets table, and you can use them in any visual or slicer. For example, this page breaks tickets down by product, customer environment, sentiment and affected platform: